Observable universe

| Physical cosmology | ||||||||||||||
 |
||||||||||||||
| Universe · Big Bang Age of the universe Timeline of the Big Bang Ultimate fate of the universe
|
||||||||||||||
In Big Bang cosmology, the observable universe consists of the galaxies and other matter that we can in principle observe from Earth in the present day, because light (or other signals) from those objects has had time to reach us since the beginning of the cosmological expansion. Assuming the Universe is isotropic, the distance to the edge of the observable universe is roughly the same in every direction—that is, the observable universe is a spherical volume (a ball) centered on the observer, regardless of the shape of the Universe as a whole. The actual shape of the Universe may or may not be spherical. However, the portion of it that we (humans, from the perspective of planet Earth) are able to observe is determined by whether or not the light and other signals originating from distant objects has had time to arrive at our point of observation (planet Earth). Therefore, the observable universe appears from our perspective to be spherical. Every location in the Universe has its own observable universe which may or may not overlap with the one centered around the Earth.
The word observable used in this sense does not depend on whether modern technology actually permits detection of radiation from an object in this region (or indeed on whether there is any radiation to detect). It simply indicates that it is possible in principle for light or other signals from the object to reach an observer on Earth. In practice, we can see objects only as far as the surface of last scattering, before which the Universe was opaque to photons. However, it may be possible in the future to observe the still older neutrino background, or even more distant events via gravitational waves (which also move at the speed of light). Sometimes a distinction is made between the visible universe, which includes only signals emitted since the last scattering time, and the observable universe, which includes signals since the beginning of the cosmological expansion (the Big Bang in traditional cosmology, the end of the inflationary epoch in modern cosmology). The radius of the observable universe is about 2% larger than the radius of the visible universe by this definition.
The age of the Universe is about 13.75 billion years, but due to the expansion of space we are now observing objects that are now considerably farther away than a static 13.75 billion light-years distance. The diameter of the observable universe is estimated to be about 28 billion parsecs (93 billion light-years),[1] putting the edge of the observable universe at about 46-47 billion light-years away.[2][3]
Contents |
The Universe versus the observable universe
While special relativity constrains objects in the Universe from moving faster than the speed of light with respect to each other, there is no such constraint when space itself is expanding. This means that the size of the observable universe could be smaller than the entire universe; there are some parts of the Universe which might never be close enough for the light to overcome the speed of the expansion of space, in order to be observed on Earth. Some parts of the Universe which are currently observable may later be unobservable due to ongoing expansion.[4][5]
Some parts of the Universe may simply be too far away for the light from there to have reached Earth. Due to the expansion of space, at a later time they could be observed.
Both popular and professional research articles in cosmology often use the term "Universe" to mean "observable universe". This can be justified on the grounds that we can never know anything by direct experimentation about any part of the Universe that is causally disconnected from us, although many credible theories require a total Universe much larger than the observable universe. No evidence exists to suggest that the boundary of the observable universe corresponds precisely to the physical boundary of the universe (if such a boundary exists); this is exceedingly unlikely in that it would imply that Earth is exactly at the center of the Universe, in violation of the Copernican principle. It is likely that the galaxies within our visible universe represent only a minuscule fraction of the galaxies in the Universe. According to the theory of cosmic inflation and its founder, Alan Guth, if it is assumed that inflation began about 10-37 seconds after the Big Bang, then with the plausible assumption that the size of the Universe at this time was approximately equal to the speed of light times its age, that would suggest that at present the entire Universe's size is at least 1023 times larger than the size of the observable Universe.[6]
It is also possible that the Universe is smaller than the observable universe. In this case, what we take to be very distant galaxies may actually be duplicate images of nearby galaxies, formed by light that has circumnavigated the Universe. It is difficult to test this hypothesis experimentally because different images of a galaxy would show different eras in its history, and consequently might appear quite different. A 2004 paper[7] claims to establish a lower bound of 24 gigaparsecs (78 billion light-years) on the diameter of the whole Universe, meaning the smallest possible diameter for the whole universe would be only slightly smaller than the observable universe (and this is only a lower bound, so the whole universe could be much larger, even infinite). This value is based on matching-circle analysis of the WMAP data. Recently, this approach has been criticized[8].
Size
The comoving distance from Earth to the edge of the observable universe is about 14 billion parsecs (46.5 billion light-years) in any direction. The visible universe is thus a sphere with a diameter of about 28 billion parsecs (about 93 billion light-years). Assuming that space is roughly flat, this size corresponds to a comoving volume of about 3×1080 cubic meters. This is equivalent to a volume of about 41 decillion cubic light-years short scale (4.1 X 1034 cubic light years).
The figures quoted above are distances now (in cosmological time), not distances at the time the light was emitted. For example, the cosmic microwave background radiation that we see right now was emitted at the time of recombination, 379,000[9] years after the Big Bang, which occurred around 13.7 billion (13.7×10⁹) years ago. This radiation was emitted by matter that has, in the intervening time, mostly condensed into galaxies, and those galaxies are now calculated to be about 46 billion light-years from us. To estimate the distance to that matter at the time the light was emitted, a mathematical model of the expansion must be chosen and the scale factor, a(t), calculated for the selected time since the Big Bang, t. For the observationally-favoured Lambda-CDM model, using data from the WMAP spacecraft, such a calculation yields a scale factor change of approximately 1292. This means the Universe has expanded to 1292 times the size it was when the CMBR photons were released. Hence, the most distant matter that is observable at present, 46 billion light-years away, was only 36 million light-years away from the matter that would eventually become Earth when the microwaves we are currently receiving were emitted.
Misconceptions
Many secondary sources have reported a wide variety of incorrect figures for the size of the visible universe. Some of these figures are listed below, with brief descriptions of possible reasons for misconceptions about them.
- 13.7 billion light-years. The age of the Universe is estimated to be 13.7 billion years. While it is commonly understood that nothing travels faster than light, it is a common misconception that the radius of the observable universe must therefore amount to only 13.7 billion light-years. This reasoning makes sense only if the Universe is the flat spacetime of special relativity; in the real Universe, spacetime is highly curved on cosmological scales, which means that 3-space (which is roughly flat) is expanding, as evidenced by Hubble's law. Distances obtained as the speed of light multiplied by a cosmological time interval have no direct physical significance.[10]
- 15.8 billion light-years. This is obtained in the same way as the 13.7 billion light year figure, but starting from an incorrect age of the Universe which was reported in the popular press in mid-2006.[11][12][13] For an analysis of this claim and the paper that prompted it, see.[14]
- 27.4 billion light-years. This is a diameter obtained from the (incorrect) radius of 13.7 billion light-years.
- 78 billion light-years. This is a lower bound for the diameter of the whole Universe (not just the observable part), if we postulate that the Universe is finite in size due to its having a nontrivial topology (as discussed in this article), with this lower bound based on the estimated current distance between points that we can see on opposite sides of the cosmic microwave background radiation (CMBR). If the whole Universe is smaller than this sphere, then light has had time to circumnavigate it since the big bang, producing multiple images of distant points in the CMBR, which would show up as patterns of repeating circles.[15] Cornish et al. looked for such an effect at scales of up to 24 gigaparsecs (78 billion light years) and failed to find it, and suggested that if they could extend their search to all possible orientations, they would then "be able to exclude the possibility that we live in a Universe smaller than 24 Gpc in diameter". The authors also estimated that with "lower noise and higher resolution CMB maps (from WMAP's extended mission and from Planck), we will be able to search for smaller circles and extend the limit to ~28 Gpc."[7] This estimate of the maximum diameter of the CMBR sphere that will be visible in planned experiments corresponds to a radius of 14 gigaparsecs, or around 46 billion light years, about the same as the figure for the radius of the observable Universe given in the opening section.
- 156 billion light-years. This figure was obtained by doubling 78 billion light-years on the assumption that it is a radius. Since 78 billion light-years is already a diameter, the doubled figure is incorrect. This figure was very widely reported.[16][17][18]
- 180 billion light-years. This estimate accompanied the age estimate of 15.8 billion years in some sources;[19] it was obtained by adding 15% to the figure of 156 billion light years.
Large-scale structure
Sky surveys and mappings of the various wavelength bands of electromagnetic radiation (in particular 21-cm emission) have yielded much information on the content and character of the universe's structure. The organization of structure appears to follow as a hierarchical model with organization up to the scale of superclusters and filaments. Larger than this, there seems to be no continued structure, a phenomenon which has been referred to as the End of Greatness.
Walls, filaments and voids

The organization of structure arguably begins at the stellar level, though most cosmologists rarely address astrophysics on that scale. Stars are organized into galaxies, which in turn form clusters and superclusters that are separated by immense voids, creating a vast foam-like structure sometimes called the "cosmic web". Prior to 1989, it was commonly assumed that virialized galaxy clusters were the largest structures in existence, and that they were distributed more or less uniformly throughout the universe in every direction. However, based on redshift survey data, in 1989 Margaret Geller and John Huchra discovered the "Great Wall", a sheet of galaxies more than 500 million light-years long and 200 million wide, but only 15 million light-years thick. The existence of this structure escaped notice for so long because it requires locating the position of galaxies in three dimensions, which involves combining location information about the galaxies with distance information from redshifts. In April 2003, another large-scale structure was discovered, the Sloan Great Wall. In August 2007, a possible supervoid was detected in the constellation Eridanus.[20] It coincides with the 'WMAP Cold Spot', a cold region in the microwave sky that is highly improbable under the currently favored cosmological model. This supervoid could cause the cold spot, but to do so it would have to be improbably big, possibly a billion light-years across.
In more recent studies the universe appears as a collection of giant bubble-like voids separated by sheets and filaments of galaxies, with the superclusters appearing as occasional relatively dense nodes. This network is clearly visible in the 2dF Galaxy Redshift Survey. In the figure a 3-D reconstruction of the inner parts of the survey is shown, revealing an impressive view on the cosmic structures in the nearby universe. Several superclusters stand out, such as the Sloan Great Wall, the largest structure in the universe known to date.
End of Greatness
The End of Greatness is an observational scale discovered at roughly 100 Mpc (roughly 300 million lightyears) where the lumpiness seen in the large-scale structure of the universe is homogenized and isotropized as per the Cosmological Principle. The superclusters and filaments seen in smaller surveys are randomized to the extent that the smooth distribution of the universe is visually apparent. It was not until the redshift surveys of the 1990s were completed that this scale could accurately be observed.[21]
Observations
Another indicator of large-scale structure is the 'Lyman alpha forest'. This is a collection of absorption lines which appear in the spectral lines of light from quasars, which are interpreted as indicating the existence of huge thin sheets of intergalactic (mostly hydrogen) gas. These sheets appear to be associated with the formation of new galaxies.
Some caution is required in describing structures on a cosmic scale because things are not always as they appear to be. Bending of light by gravitation (gravitational lensing) can result in images which appear to originate in a different direction from their real source. This is caused by foreground objects (such as galaxies) curving the space around themselves (as predicted by general relativity), deflecting light rays that pass nearby. Rather usefully, strong gravitational lensing can sometimes magnify distant galaxies, making them easier to detect. Weak lensing (gravitational shear) by the intervening universe in general also subtly changes the observed large-scale structure. In 2004, measurements of this subtle shear show considerable promise as a test of cosmological models.
The large-scale structure of the Universe also looks different if one only uses redshift to measure distances to galaxies. For example, galaxies behind a galaxy cluster will be attracted to it, and so fall towards it, and so be slightly blueshifted (compared to how they would be if there were no cluster); on the near side, things are slightly redshifted. Thus, the environment of the cluster looks a bit squashed if using redshifts to measure distance. An opposite effect works on the galaxies already within the cluster: the galaxies have some random motion around the cluster centre, and when these random motions are converted to redshifts, the cluster will appear elongated. This creates what is known as a finger of God: the illusion of a long chain of galaxies pointed at the Earth.
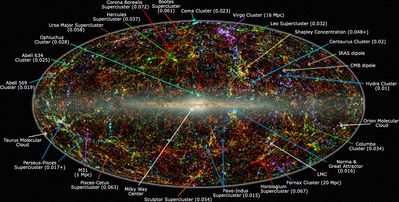
Cosmography of our neighborhood
At the centre of the Hydra supercluster there is a gravitational anomaly, known as the Great Attractor, which affects the motion of galaxies over a region hundreds of millions of light-years across. These galaxies are all redshifted, in accordance with Hubble's law, indicating that they are receding from us and from each other, but the variations in their redshift are sufficient to reveal the existence of a concentration of mass equivalent to tens of thousands of galaxies.
The Great Attractor, discovered in 1986, lies at a distance of between 150 million and 250 million light-years (250 million is the most recent estimate), in the direction of the Hydra and Centaurus constellations. In its vicinity there is a preponderance of large old galaxies, many of which are colliding with their neighbours, and/or radiating large amounts of radio waves.
In 1987 Astronomer R. Brent Tully of the University of Hawaii’s Institute of Astronomy identified what he called the Pisces-Cetus Supercluster Complex, a structure one billion light years long and 150 million light years across in which, he claimed, the Local Supercluster was embedded.[23][24]
Matter content
The observable universe contains about 3 to 7 × 10²² stars (30 to 70 sextillion stars),[25] organized in more than 80 billion galaxies, which themselves form clusters and superclusters.[26]
Two approximate calculations give the number of atoms in the observable universe to be a minimum of 1080.
- Observations of the cosmic microwave background from the Wilkinson Microwave Anisotropy Probe suggest that the spatial curvature of the Universe is very close to zero, which in current cosmological models implies that the value of the density parameter must be very close to a certain critical value. This works out to 9.9×10⁻²⁷ kg/m3,[27] which would be equal to about 5.9 hydrogen atoms per cubic meter. Analysis of the WMAP results suggests that only about 4.6% of the critical density is in the form of normal atoms, while 23% is thought to be made of cold dark matter and 72% is thought to be dark energy,[27] so this leaves 0.27 hydrogen atoms/m3. Multiplying this by the volume of the visible universe, you get about 8×1079 hydrogen atoms.
- A typical star has a mass of about 2×1030 kg, which is about 1×1057 atoms of hydrogen per star. A typical galaxy has about 400 billion stars so that means each galaxy has 1×1057 × 4×1011 = 4×1068 hydrogen atoms. There are possibly 80 billion galaxies in the Universe, so that means that there are about 4×1068 × 8×1010 = 3×1079 hydrogen atoms in the observable universe. But this is definitely a lower limit calculation, and it ignores many possible atom sources such as intergalactic gas.[28]
Mass
The mass of the matter in the observable universe can be estimated based on density and size.[29]
Estimation based on the measured stellar density
One way to calculate the mass of the visible matter which makes up the observable universe is to assume a mean stellar mass and to multiply that by an estimate of the number of stars in the observable universe. The estimate of the number of stars in the Universe is derived from the volume of the observable universe
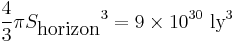
and a stellar density calculated from observations by the Hubble Space Telescope
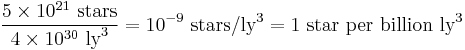 , (or 1 star per cube, 1000 ly to a side (x,y,z))
yielding an estimate of the number of stars in the observable universe of 9 × 10²¹ stars (9 billion trillion stars).
Taking the mass of Sol (2 × 1030 kg) as the mean stellar mass (on the basis that the large population of dwarf stars balances out the population of stars whose mass is greater than Sol) and rounding the estimate of the number of stars up to 1022 yields a total mass for all the stars in the observable universe of 3 × 1052 kg.[30] However, as noted in the "matter content" section, the WMAP results in combination with the Lambda-CDM model predict that less than 5% of the total mass of the observable universe is made up of visible matter such as stars, the rest being made up of dark matter and dark energy.
Sir Fred Hoyle calculated the mass of an observable steady-state universe using the formula:[31]
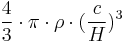
which can also be stated as

or approximately 8 × 1052 kg.
Here H = Hubble constant, ρ = Hoyle's value for the density, G = gravitational constant and c = speed of light.
Most distant objects
The most distant astronomical object observed as of 2009 is a gamma ray burst, most likely caused by a star which collapsed when the universe was approximately 600 million years old.[32]
Cosmological horizon
The cosmological horizon, (also known as the particle horizon) is the maximum distance from which particles could have traveled to the observer in the age of the universe. It represents the boundary between the observable and the unobservable regions of the universe.[33] The existence, properties, and significance of a cosmological horizon depend on the particular cosmological model being discussed.
In terms of comoving distance, the particle horizon is equal to the conformal time  that has passed since the Big Bang, times the speed of light
  . The quantity is given by,
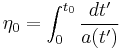
where  is the scale factor of the Friedmann-Lemaître-Robertson-Walker metric, and we have taken the Big Bang to be at
  . In other words, the particle horizon recedes constantly as time passes, and the observed fraction of the universe always increases.[33][34]
The particle horizon differs from the event horizon in that the particle horizon represents the largest comoving distance from which light could have reached the observer by a specific time, while the event horizon is the largest comoving distance from which light emitted now can ever reach the observer.[35]
 The Neighbouring Superclusters |
 Speculative image of the observable universe |
See also
- Causality (physics)
- Event horizon of the universe
- Hubble volume
- Multiverse
- Observable
- Observation
- Omniverse
- Open multiverse
- Particle horizon
- Universe
References
- ↑ Itzhak Bars, John Terning, and Farzad Nekoogar. Extra Dimensions in Space and Time (2009), page 27.
- ↑ http://www.astro.ucla.edu/~wright/cosmology_faq.html#DN
- ↑ Lineweaver, Charles; Tamara M. Davis (2005). "Misconceptions about the Big Bang". Scientific American. http://www.sciam.com/article.cfm?id=misconceptions-about-the-2005-03&page=5. Retrieved 2008-11-06.
- ↑ Using Tiny Particles To Answer Giant Questions. Science Friday, 3 Apr 2009.
- ↑ See also Faster than light#Universal_expansion.
- ↑ Guth, Alan (1997). The Inflationary Universe, p. 186
- ↑ 7.0 7.1 Neil J. Cornish, David N. Spergel, Glenn D. Starkman, and Eiichiro Komatsu, Constraining the Topology of the Universe. Phys. Rev. Lett. 92, 201302 (2004). astro-ph/0310233
- ↑ http://arxiv.org/abs/1007.3466
- ↑ Abbott, Brian (May 30, 2007). "Microwave (WMAP) All-Sky Survey". Hayden Planetarium. http://www.haydenplanetarium.org/universe/duguide/exgg_wmap.php. Retrieved 2008-01-13.
- ↑ Ned Wright, "Why the Light Travel Time Distance should not be used in Press Releases".
- ↑ SPACE.com - Universe Might be Bigger and Older than Expected
- ↑ Big bang pushed back two billion years - space - 04 August 2006 - New Scientist Space
- ↑ 2 billion years added to age of Universe
- ↑ Edward L. Wright, "An Older but Larger Universe?".
- ↑ Bob Gardner's "Topology, Cosmology and Shape of Space" Talk, Section 7
- ↑ SPACE.com - Universe Measured: We're 156 Billion Light-years Wide!
- ↑ New study super-sizes the Universe - Space.com - MSNBC.com
- ↑ "Astronomers size up the Universe". BBC News. 2004-05-28. http://news.bbc.co.uk/2/hi/science/nature/3753115.stm. Retrieved 2010-05-20.
- ↑ Space.com - Universe Might be Bigger and Older than Expected
- ↑ Biggest void in space is 1 billion light years across - space - 24 August 2007 - New Scientist Space
- ↑ Robert P Kirshner (2002). The Extravagant Universe: Exploding Stars, Dark Energy and the Accelerating Cosmos. Princeton University Press. p. 71. ISBN 0691058628. http://books.google.com/?id=qQ_mV2prqNYC&pg=PA71.
- ↑ "Large Scale Structure in the Local Universe: The 2MASS Galaxy Catalog", Jarrett, T.H. 2004, PASA, 21, 396
- ↑ Massive Clusters of Galaxies Defy Concepts of the Universe N.Y. Times Tue. November 10, 1987:
- ↑ Map of the Pisces-Cetus Supercluster Complex:
- ↑ "Astronomers count the stars". BBC News. July 22, 2003. http://news.bbc.co.uk/2/hi/science/nature/3085885.stm. Retrieved 2006-07-18.
- ↑ How many galaxies in the Universe? says "the Hubble telescope is capable of detecting about 80 billion galaxies. In fact, there must be many more than this, even within the observable universe, since the most common kind of galaxy in our own neighborhood is the faint dwarfs which are difficult enough to see nearby, much less at large cosmological distances."
- ↑ 27.0 27.1 WMAP- Content of the Universe
- ↑ Matthew Champion, "Re: How many atoms make up the universe?", 1998
- ↑ McPherson, Kristine (2006). "Mass of the Universe". The Physics Factbook. http://hypertextbook.com/facts/2006/KristineMcPherson.shtml.
- ↑ (PDF) On the expansion of the Universe. NASA Glenn Research Centre. http://www.grc.nasa.gov/WWW/K-12/Numbers/Math/documents/ON_the_EXPANSION_of_the_UNIVERSE.pdf.
- ↑ Helge Kragh (1999-02-22). Cosmology and Controversy: The Historical Development of Two Theories of the Universe. Princeton University Press. p. 212, Chapter 5. ISBN 0-691-00546-X. http://books.google.com/?id=GhVkQwv9ZesC&pg=PA212.
- ↑ http://www.npr.org/templates/story/story.php?storyId=114246224
- ↑ 33.0 33.1 http://books.google.com/books?id=kNxeHD2cbLYC&pg=PA447&dq=%22Particle+horizon%22&as_brr=3#v=onepage&q=%22Particle%20horizon%22&f=false Cosmology: the science of the universe By Edward Robert Harrison, p. 447
- ↑ http://books.google.com/books?id=xma1QuTJphYC&pg=PA418&dq=%22Particle+horizon%22&as_brr=3#v=onepage&q=%22Particle%20horizon%22&f=false General relativity: an introduction for physicists By Michael Paul Hobson, George Efstathiou, Anthony N. Lasenby, p. 419
- ↑ Lars Bergström and Ariel Goobar: "Cosmology and Particle Physics", WILEY (1999), page 65. ISBN 0-471-97041-7
Further reading
- Vicent J. Martínez, Jean-Luc Starck, Enn Saar, David L. Donoho, Simon Reynolds, Pablo de la Cruz, and Silvestre Paredes (nov 2005). "Morphology Of The Galaxy Distribution From Wavelet Denoising". The Astrophysical Journal 634: 744–755. doi:10.1086/497125. arXiv:astro-ph/0508326. http://adsabs.harvard.edu/abs/2005ApJ...634..744M. Retrieved 2009-12-22.
- J. R. Mureika and C. C. Dyer (2005-05-17). "Multifractal Analysis of Packed Swiss Cheese Cosmologies". Classical and Quantum Gravity. v1. arXiv:gr-qc/0505083. http://arxiv.org/abs/gr-qc/0505083/. Retrieved 2009-12-22.
- Mureika, J. R. and Dyer, C. C. (jan 2004). "Review: Multifractal Analysis of Packed Swiss Cheese Cosmologies". General Relativity and Gravitation 36: 151–184. doi:10.1023/B:GERG.0000006699.45969.49. arXiv:gr-qc/0505083. http://adsabs.harvard.edu/abs/2004GReGr..36..151M. Retrieved 2009-12-22.
- Gott, III, J. R. et al. (may 2005). "A Map of the Universe". The Astrophysical Journal 624: 463–484. doi:10.1086/428890. arXiv:astro-ph/0310571. http://adsabs.harvard.edu/abs/2005ApJ...624..463G. Retrieved 2009-12-22.
- F. Sylos Labini, M. Montuori and L. Pietronero (1998). "Scale-invariance of galaxy clustering". Physics Reports 293: 61–226. doi:10.1023/B:GERG.0000006699.45969.49. arXiv:astro-ph/9711073v1. http://adsabs.harvard.edu/abs/1998PhR...293...61S. Retrieved 2009-12-22.
External links
- "Millennium Simulation" of structure forming Max Planck Institute of Astrophysics, Garching, Germany
- The Sloan Great Wall: Largest Known Structure? on APOD
- Hubble, VLT and Spitzer Capture Galaxy Formation in the Early Universe.
- Cosmology FAQ
- Hubble, VLT and Spitzer Capture Galaxy Formation in the Early Universe
- Star Survey reaches 70 sextillion
- Inflation and the Cosmic Microwave Background, Lineweaver 2003
- Animation of the cosmic light horizon
- Logarithmic Maps of the Universe
- List of publications of the 2dF Galaxy Redshift Survey
- List of publications of the 6dF Galaxy Redshift and peculiar velocity survey
|
||||||||